by: Kenny Tavares, Senior Consultant & Lead Data Analyst

Kenny Tavares
Microsoft Excel is undoubtedly one of the most adaptable tools I have used in my prospect research and data analysis work. To paraphrase an old commercial: “It slices, it dices, it makes julienne fries!”
Seriously, its many applications have led me to always assume Excel can accomplish what I need and then find a way to make it happen. I love unlocking the formula or macro that makes arduous tasks effortless. Even as I delve deeper into coding for data transformation and analysis in other more sophisticated tools, my foundational understanding of data structure is rooted in using Excel. I’m sure many of you share this sentiment.
Fortunately, Excel is here to stay, with Microsoft continually enhancing its functionality to match our evolving workflows. However, as creatures of habit, we often overlook these new features; we stick to what we know.
I’d like to highlight the Data Types feature, which enhances data, making it more dynamic, thus making analysis more robust. It’s straightforward to use and can save you valuable time. You might be surprised at what you can do without running to your web browser!
There are three Data Types available: Stocks, Currencies and Geography. We’ll explore Stocks in detail as a case example:
How It Works
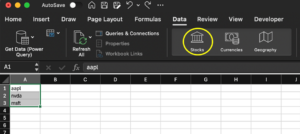
Imagine you’re tracking a prospect’s portfolio that includes stocks in Apple, NVIDIA, and Microsoft. You enter their ticker symbols in a column, select those cells, go to the Data tab, and choose Stocks.
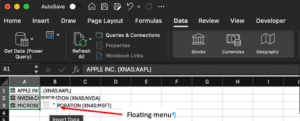
Excel will then turn these symbols into linked data fields. If you see an icon next to the stock name, it means it worked:

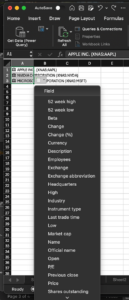
Clicking on the floating menu next to the cell will give you more than two dozen data points to choose from:

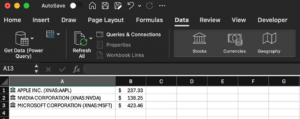
Let’s say you are interested in stock price simply select that option and the data will then be added in a new column — Voila!

Then, you can just multiply the stock price by the number of shares:

Even better, the next time you open the spreadsheet, the stock prices will update automatically. You can also manually update the data by choosing Refresh from the Data menu.
Other Use Cases
Stocks: Another great use for the Stocks type is business valuation. To assess the value of a privately-owned company, create a custom list of similar publicly-traded companies and use the floating menu to add useful info like employee counts, market cap, and price-to-earnings (P/E) ratio. Instead of copying and pasting from a web browsesr, you can gather all this info using Excel.
Furthermore, you can pair the Stocks information with the STOCKHISTORY formula to generate a list of historical prices for a selected date range without exporting from another website.
Geography: The Geography type is great for enriching a list of addresses. By applying it to a zip code, you can get city/town info like population, county, state, and coordinates.
With the Power Map add-in, you can map out your prospect’s locations. From the county data, you can access more info like the largest city. From state data, you can get Census info like median income and home values. In no time, your simple dataset can be transformed into something more insightful.
Currencies: Using the Currencies type, you can get updated exchange rates by entering the abbreviations for the two currencies you want to check, for example, Hong Kong Dollar to US Dollar (HKD/USD). Excel will give the rate, which you can then use in your calculations. This makes it easier to evaluate an international prospects’ wealth, especially one with a lot of foreign holdings.
Summary
Excel’s continuous evolution and feature expansion ensures it remains an invaluable tool for prospect researchers and data analysts. Hopefully, the Data Types feature will make your workflow more efficient. By leveraging these innovative tools, you can unlock new possibilities and insights, making your data work for you more effectively. So, take the time to explore these features and see how they can transform your approach to data.
