 It’s here! The 20th anniversary Capgemini World Wealth Report is now available to be downloaded and discussed.
As in previous years, the Report’s high-beam focus has been on global high net worth individuals (HNWIs); their distribution geographically as well as the distribution of their assets, the world markets and how performance has affected portfolios in the past year, and what HNWIs need from their investment managers.
All of that is in this year’s report, but the focus of this 20th edition sheds light on the financial industry itself and the challenges it faces in the face of industry threats, including the need to keep up with digital technology, and inroads being made by ‘robo-advisors.’
(A robo-advisor is an online financial advisory firm that uses automation and/or algorithms to manage client portfolios. Robo-advisors offer investment management services to clients more cheaply than a human financial advisor, but there is the obvious drawback of not having someone with experience helping guide the investor).
If you have a prospect in the financial services/financial advising industry, this would certainly be something of concern to them and worth your understanding.
In this year’s report there were quite a few items that made me pick up my highlighter, and I’m excited to share them with you.
Like this:
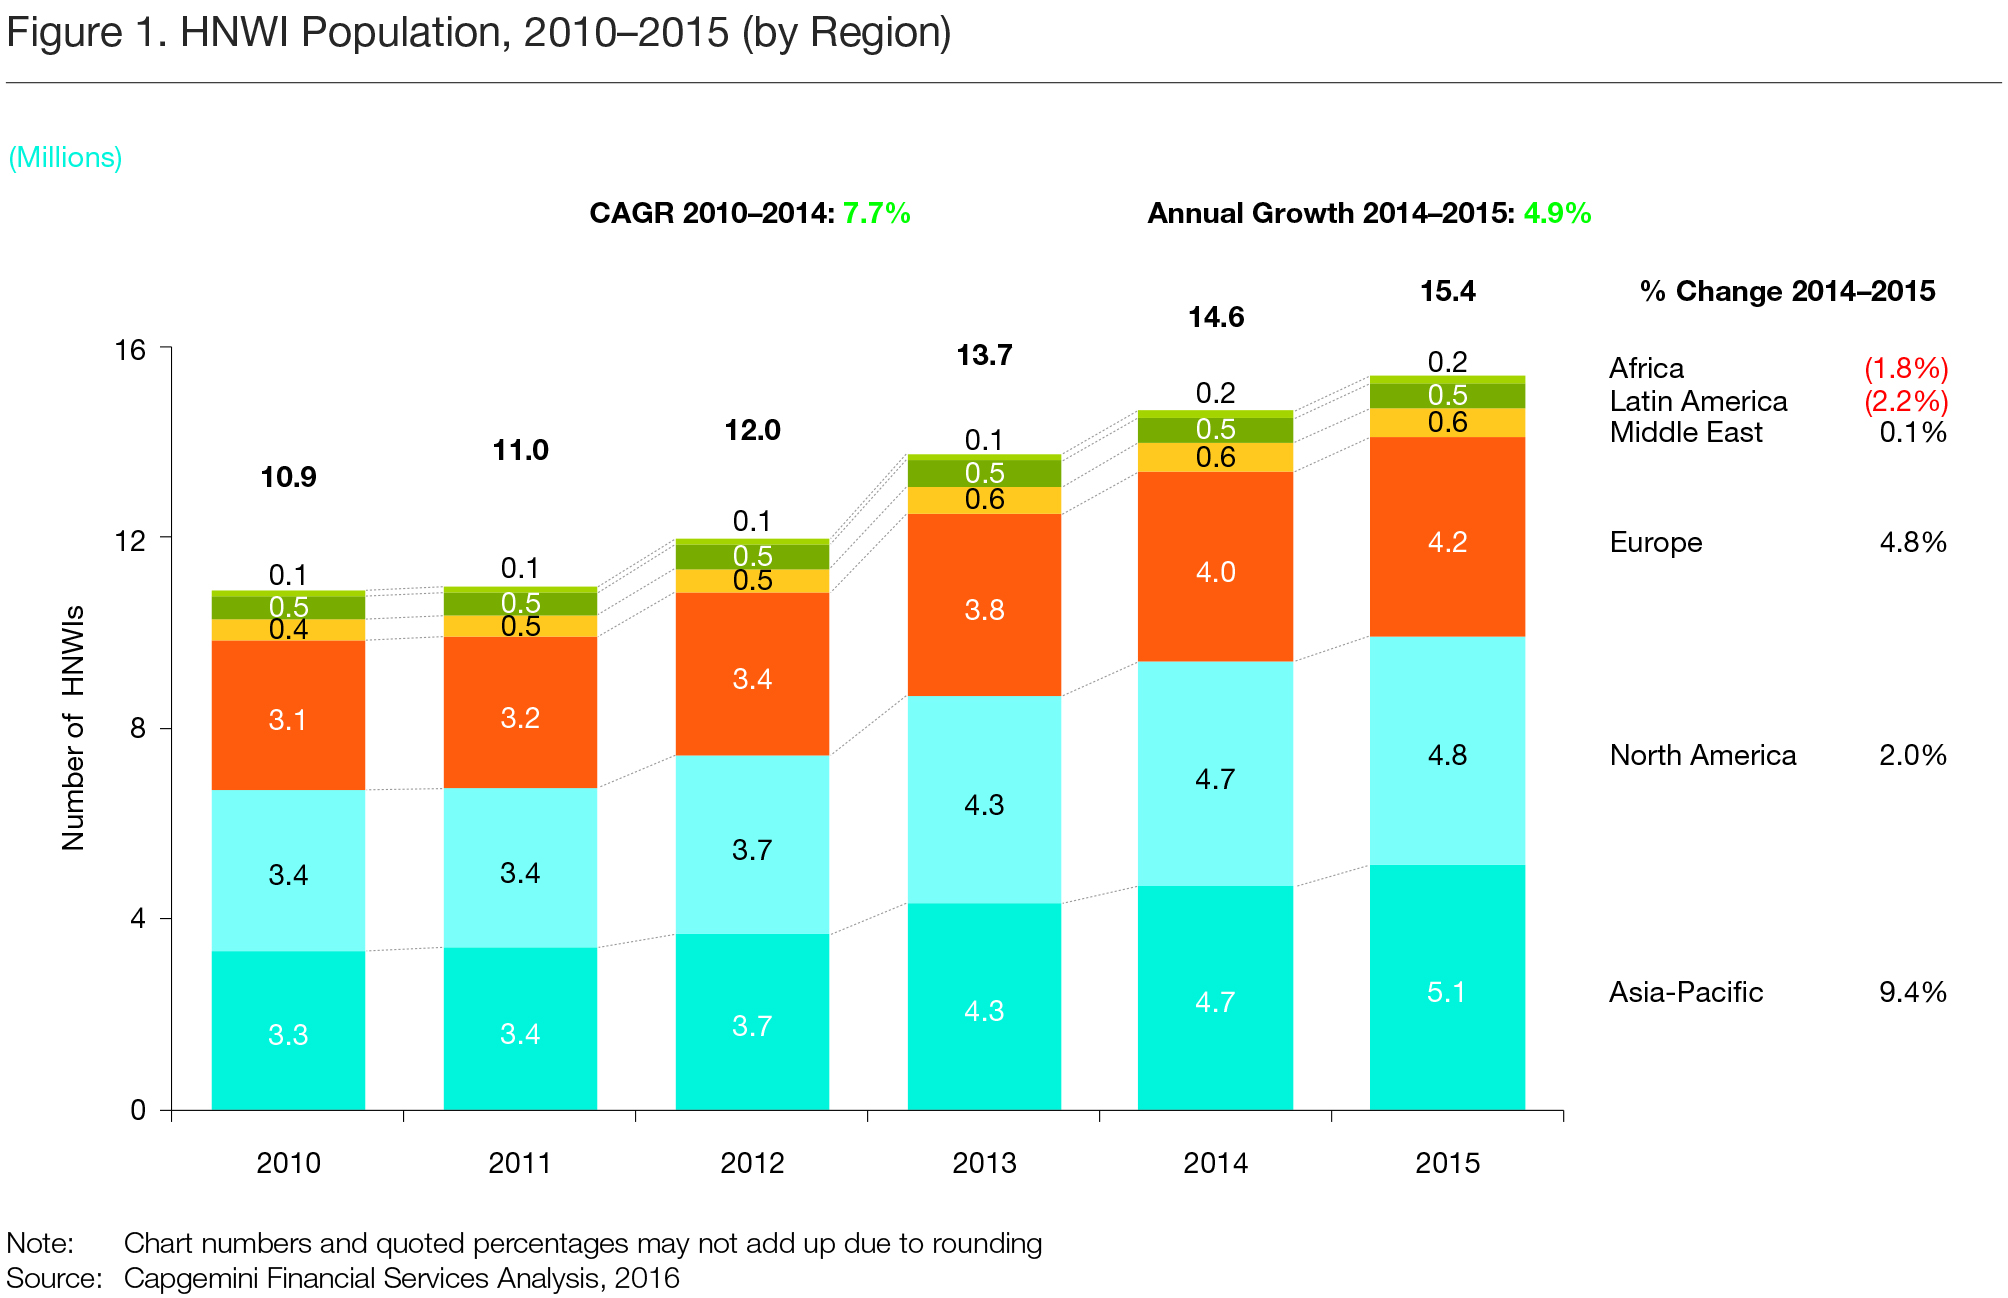
For the first time, the Asia-Pacific region surpassed North America to become the region with the largest amount of HNWI wealth and HNWI population.
Why? While the North American real estate markets and economies did well generally, the stock markets last year did not have a great performance, especially compared to China’s. This allowed China and Japan, the greatest economic drivers in the region, to help Asia Pacific edge ahead in both the population of HNWIs (5.1 million in Asia Pacific to 4.8 million in North America) and the amount of assets they held ($17.4 trillion in Asia Pacific to $16.6 trillion held by HNWIs in North America)
What this means for us in fundraising:
This area is only going to continue to grow. Start bulking up on your Asian resources if you have prospects living there.
Growth in the HNWI population in Europe was double that of North America last year.
But with the European markets in turmoil after the results of the Brexit referendum last week, what will the WWR17 charts look like in comparison?
What this means for us in fundraising:
Nobody knows. Fasten your seat belts, it’s going to be a bumpy ride. Now probably isn’t the time to ask HNWI prospects in the UK for a gift, though.
More than 61% of all HNWIs live in four countries
The United States, Japan, Germany and China. Since the majority of HNWIs globally are in the financial services industry (according to the Forbes World’s Billionaires list), look for Germany’s HNWI population to increase as banks consider moving operations from London to Paris, Dublin, and Frankfurt due to Brexit.
What this means for us in fundraising:
If you’ve worked with prospects in London that will now be moving to the continent, it may be worth your time learning more about EU-to-US charitable giving, unless your prospect has assets or a giving vehicle here.
HNWIs globally are interested in social impact.
According to the WWR: “Globally, 31.0% of HNWI investment portfolios are based on the concept of achieving social gain…” and almost half expect their social investments to increase over the next two years. Merrill Lynch recently released a balanced white paper on impact investing that argues in favor of the activity (with certain caveats).
What this means for us in fundraising:
Almost 14% of HNWIs’ social investing currently goes toward social impact bonds (SIBs). As the opportunities and interest increases for investment in this area by HNWI, they may be worth your nonprofit looking into.
And finally, my favorite:
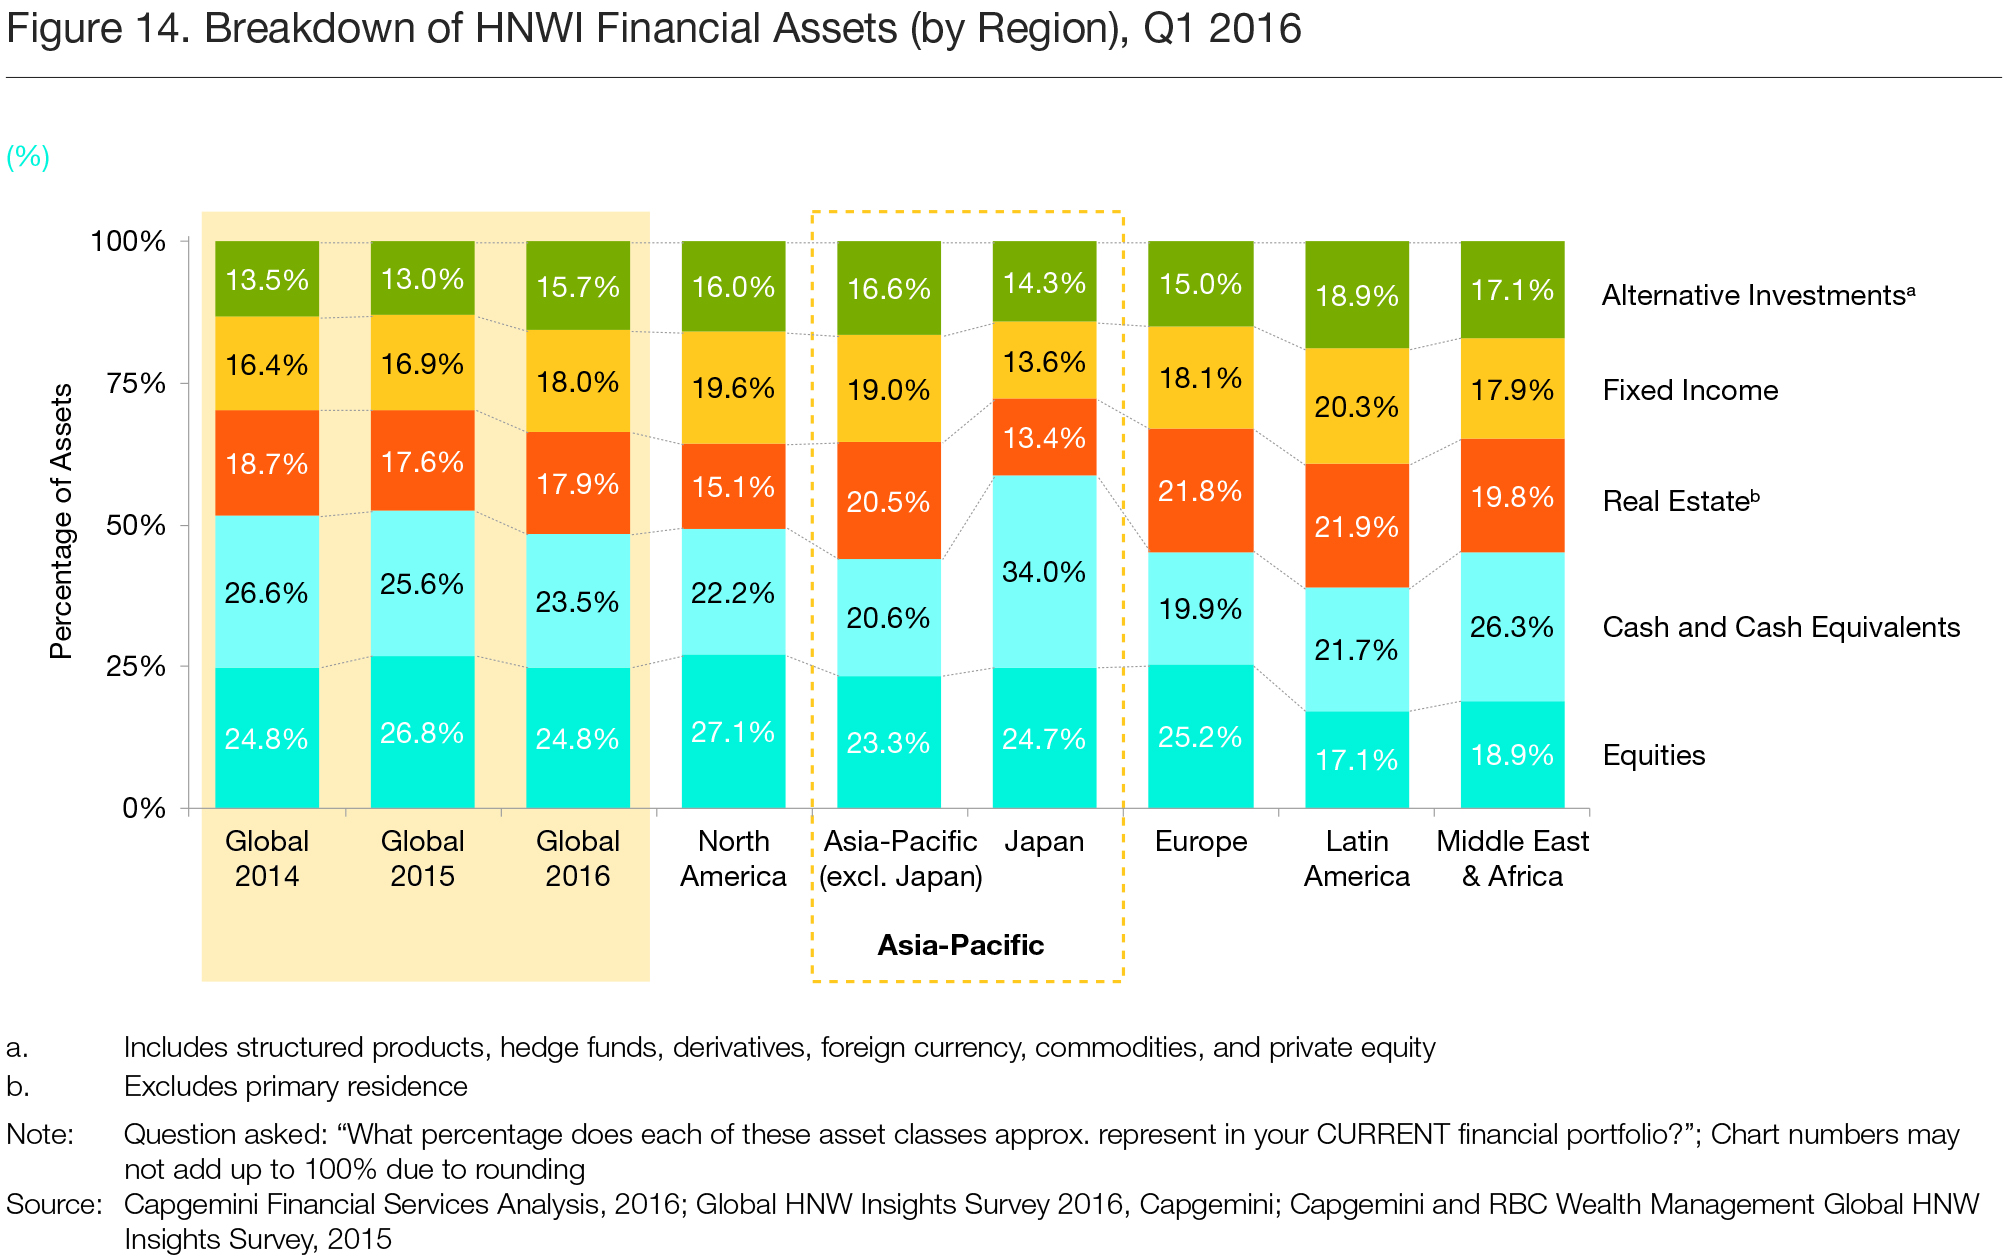
The chart on page 19 illustrates the breakdown of HNWI financial assets by type and by region.
Here it is, in all its glory:
What this means for us in prospect research: if you are researching a HNWI living anywhere in the world, and you only know one of her asset classes (real estate, for example), you can use this chart to extrapolate a better estimate of what her total asset holdings might be.
What other nuggets have you discovered in the report? Share them here! And if you have questions related to the content of the report, the good folks in the Capgemini market intelligence department are happy to help. Email them at wealth@capgemini.com.


