Prospect research is an artfully scientific mixture of fact and conjecture. We spend a lot of time delving into sources of record like newspapers, SEC documents, real estate records, contact reports and other records from our own databases. Then we add informed opinion like white papers, rich lists, and our own experience. If we’re lucky, we can include some data science into the mix.
As we mature in the profession, what we become comfortable with is a curious amalgamation of truth and speculation that we use to rank, score, and predict which groups of people or individuals are likeliest to give to our organization.
It’s not a perfect science yet, but over the years we prospect development pros have gotten pretty good at uncovering useful information and helping organizations use it successfully. According to a recent MarketSmart major gift benchmark study, 84% of nonprofits that use prospect research meet their fundraising goals every year. Only 65% of nonprofits who don’t use prospect research meet their goals (which, you could argue is still pretty good odds, but why not be better prepared and 20% more likely to succeed?)
Last week I highlighted the Fidelity Donor Advised Fund Charitable Giving Report, which is worth adding to your reading list if you haven’t already (especially if your nonprofit type is in one of the top 5 giving priorities).
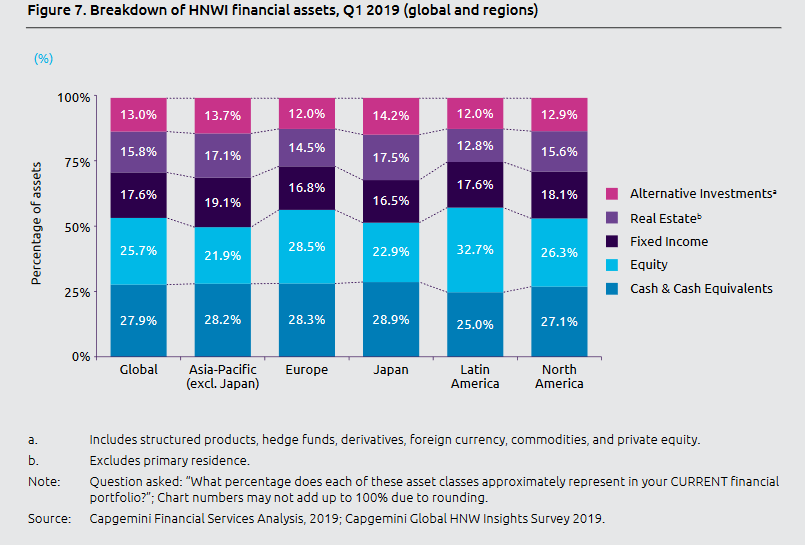
This week I want to highlight a key graphic in the 2019 Capgemini World Wealth Report (WWR) and add a little context.
In the graphic we can see the different categories of assets that high net worth individuals (HNWI) worldwide tend to hold, and the percentage of their assets that each category is.
How can we use this?
Research on people who live outside of the US is traditionally more difficult than domestic research, so any piece of information on international prospects is potentially useful. But specifically, let’s say you know one piece of the puzzle; that your French prospect has two properties beside their home. Once you find the value (or relative value) of those two properties, you know from the chart that those properties make up 14.5% of their total wealth. Calculate a back-of-the-envelope total visible asset figure et voilà.
No, it’s not hard, specific, factual, information about the individual you are researching, but it is another piece of the puzzle that you can use to get a less fuzzy picture of your prospective donor.
Something else I found interesting in the report was the discussion on how those asset allocations have changed since last year. Nervous HNW investors (whose wealth decreased last year) are moving their money out of equities and into cash, cash equivalents, fixed-income investments, and alternative investments like commodities and private equity. Does this point toward another global recession? Maybe not, but it sure doesn’t suggest that they’re bullish.
I’d love to hear your thoughts on the World Wealth Report, and if you found anything interesting in it that you’d like to share here.

